



TLDR
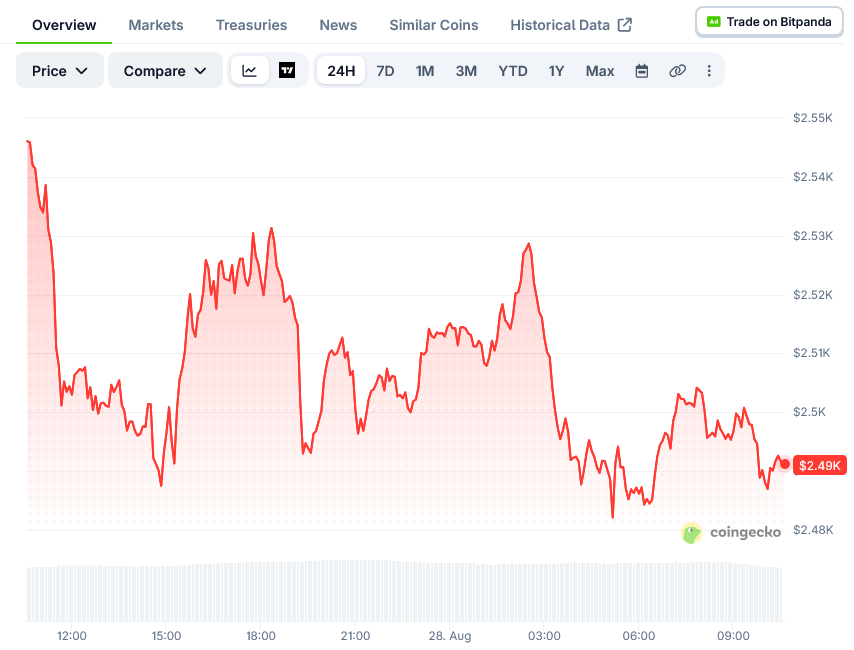
ETH is trading near $2,501 with RSI at 76 and Stochastic above 90, both flashing overbought conditions.
The MACD histogram is sitting exactly at zero, showing momentum has stalled after a strong run.
Retail traders are 70.3% long while top traders are only 57.4% long, a gap between crowd and smart money.
A pullback to the $2,426–$2,463 support zone is seen as the most likely move over the next 5–10 days.
Resistance sits at $2,552–$2,604, and clearing it opens the door to the upper Bollinger Band near $2,731.
Ethereum is trading around $2,501 after a strong climb, but the chart is now showing signs of running out of short-term steam. Every major moving average sits below the current price, which keeps the broader trend intact.
The 50-day moving average is at $1,994 and the 200-day is at $2,019. Both are well under the current price, confirming the longer-term structure remains upward.
Shorter-term momentum readings tell a different story. The MACD histogram is printing exactly zero, which means buying and selling pressure are currently balanced.
The RSI is at 76, and the Stochastic %K is above 90. Both of these are classic overbought readings, suggesting buyers may be tired for now.
ETH is also trading in the upper two-thirds of its Bollinger Band, with the upper boundary at $2,731. There is room to climb, but a pause or dip often comes first in this kind of setup.
The next resistance band sits between $2,552 and $2,604. ETH would need fresh buying pressure to push through that zone without a pullback first.
Trader Positioning Diverges
Retail traders are heavily positioned long, with 70.3% of the market betting on higher prices. Top-tier traders are less aggressive, sitting at 57.4% long.
That gap between retail and larger traders is worth watching. It suggests the crowd is more confident than the more experienced side of the market right now.
Buy and sell volume on the taker side are nearly split evenly. This means neither side is aggressively pushing price in one direction at the moment.
Open interest has grown 2.12% over the past 24 hours, reaching $6.1 billion. The funding rate is low at 0.0021%, which points to a calm rather than overheated market.
Possible Price Paths
The most likely scenario, given a 65% probability, is a pullback into the $2,426–$2,463 range over the next 5 to 10 days. If that zone holds, the path toward $2,552 and eventually $2,731 stays open over the following 20 to 30 days.
A second scenario, with 35% probability, has ETH pushing straight through $2,552–$2,604 without a dip first. This would likely require a broader market catalyst, such as Bitcoin strength or new regulatory news.
The key level to watch is $2,426. A daily close below that would break the current uptrend structure, with the next support cluster near $2,166.
As of the latest one-minute reading, ETH was trading at $2,490.08, down 0.05% on the day.