



A technical analyst known as ‘V’ has shared a striking Elliott Wave Theory-based Bitcoin price outlook on X that he believes most market participants are completely overlooking. The chart, plotted on Bitcoin’s weekly timeframe, outlines a multi-year roadmap that could first subject the cryptocurrency to significant downside pressure, potentially triggering a price crash to $40,000 before setting the stage for an explosive rally that could shock investors and traders.
Elliott Wave Pattern Points to $40,000 Bitcoin Price Dip
V’s analysis on X begins by identifying a completed five-wave structure that carried Bitcoin from its 2022 lows to an early 2025 peak around $109,354. Those waves, clearly labeled 1 through 5 on the chart, mark the end of Bitcoin’s first major impulse move.
Related Reading
From here, V projects that Bitcoin could now enter a Wave 2 correction, which could take the form of a classic ABC zigzag pattern. In this projected scenario, Wave A is forecasted to bottom somewhere between the 50% and 61.8% Fibonacci retracement levels, triggering a Bitcoin price decline to the $51,000 to $62,000 range.
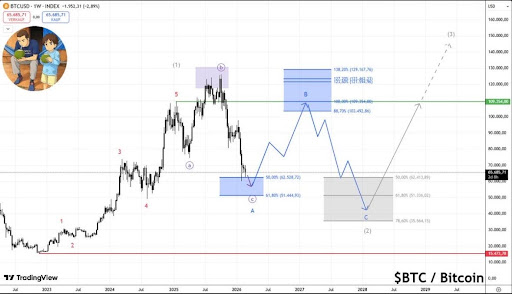
Following this, Wave B is expected to see a small relief bounce, pushing Bitcoin back up toward the 100% to 132% extension zone between $109,354 to $120,594 on the chart. Once this bounce occurs, V predicts a final downside target in Wave C. He forecasts that the Bitcoin price could decline to the $51,336 to $35,564 range, representing a massive 55% to 69% decrease from the previous bounce area.
Notably, V has stated that Bitcoin’s projected move to its final bearish target could catch the majority of investors and traders completely off guard. This is because a relief rally back towards six figures in Wave B would likely restore investor confidence and draw buyers back in, only for the market to decline all over again to an even steeper target. In other words, it could be a bull trap.
The Bitcoin End Game That Could Shock Investors
Following the anticipated completion of the Wave 2 correction, V predicts the onset of Wave 3, a phase that could trigger a powerful bullish reversal for Bitcoin. The chart illustrates a projected rally, highlighted by a rising arrow. Bitcoin is expected to retest and reclaim its previous resistance level around $109,354, marking a potential gain of more than 207% from its projected Wave C bottom around $35,564.
Related Reading
Once BTC crosses this resistance with strong momentum, the chart projects a stronger upward push toward a shocking $150,000 target. Notably, the last time Bitcoin was remotely close to this level was in October 2025, when its price skyrocketed to new all-time highs above $126,000. If the V’s Elliott Wave forecast plays out as expected, it would mark a new historic ATH for BTC.
Featured image from Getty Images, chart from Tradingview.com