


 Surges Past $69K as ETF Inflows Surge to")
Key Highlights
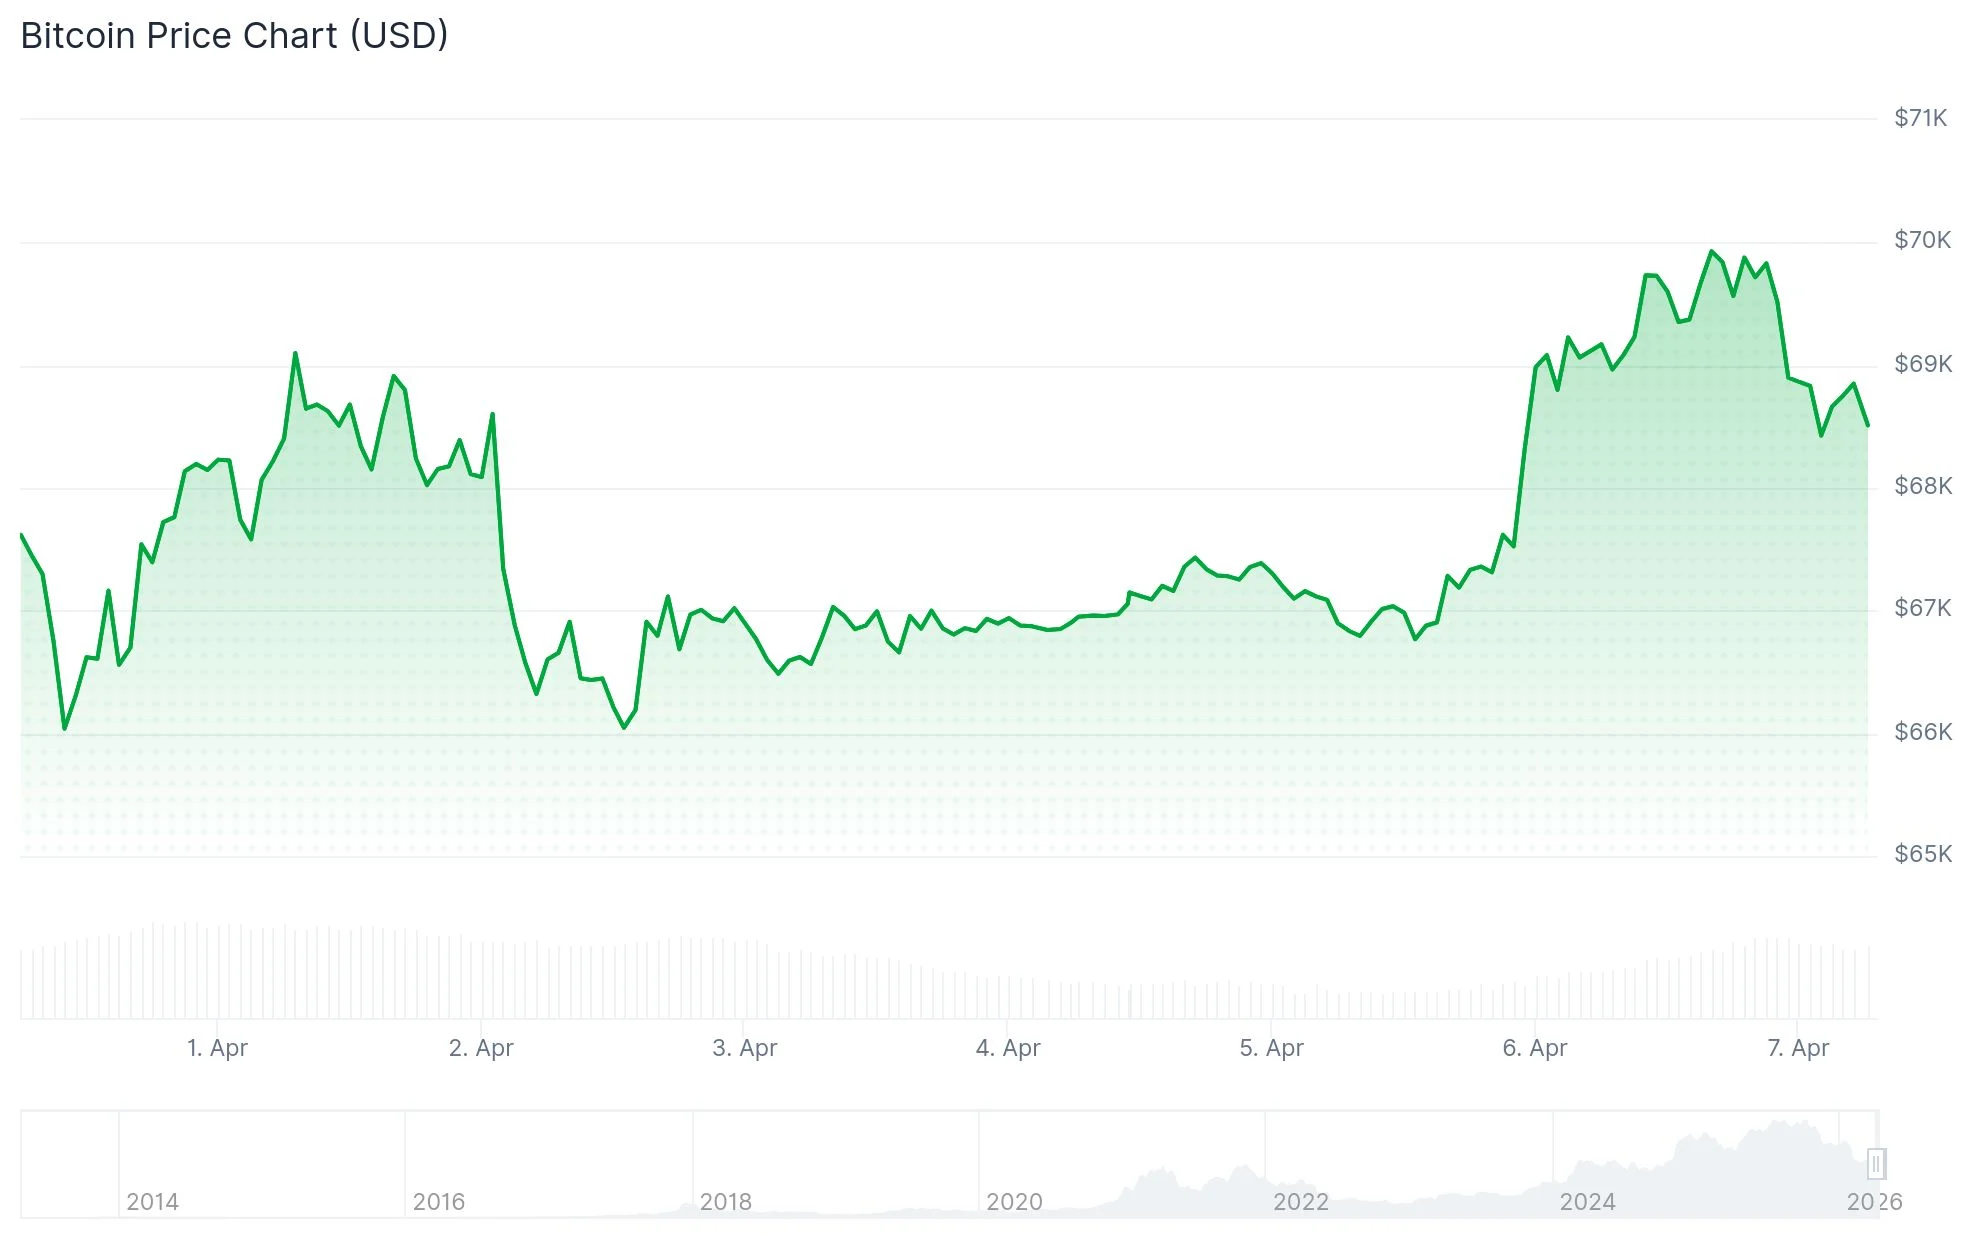
BTC surged past $69,000 for the first time in more than ten days amid heightened geopolitical tensions involving Iran
Spot Bitcoin ETFs in the United States recorded $471 million in net inflows on April 6, marking the strongest daily performance since February
IBIT from BlackRock and FBTC from Fidelity dominated ETF activity, collectively attracting approximately $329 million
Technical chart analysis reveals an ascending triangle formation suggesting a possible advance to $77,000
The percentage of BTC supply holding unrealized gains climbed back to 59% following a February decline to 52%
Bitcoin surged beyond the $69,000 threshold on Monday, registering a 3% increase over a 24-hour span, driven by geopolitical developments concerning the Strait of Hormuz and renewed institutional appetite through exchange-traded funds.
President Donald Trump delivered a stern warning to Iran over the weekend, declaring the nation would face severe consequences if the strategic waterway remained closed beyond Tuesday at 8:00 pm Eastern Time. Tehran officials countered that the strait would remain blocked pending receipt of war reparations.
CNBC characterized Trump’s approach as oscillating between diplomatic engagement and military threats. While equity markets showed minimal movement on Monday, Bitcoin experienced notable upward pressure.
Derivatives markets saw more than $265 million in short position liquidations during the upward move. Trading activity surged twofold within 24 hours, with market participants eyeing the critical $70,000 resistance level.
The Crypto Fear and Greed Index climbed from 25 to 38, moving closer to neutral sentiment for the first time in several weeks. This recovery indicates diminishing panic selling linked to geopolitical uncertainty.
Record Monthly ETF Activity Emerges
April 6 witnessed US spot Bitcoin ETFs register $471 million in net positive flows, representing the most substantial single-day accumulation since late February, per Farside Investors data. BlackRock’s IBIT product captured roughly $182 million, while Fidelity’s FBTC secured around $147 million.
Total assets under management for US spot Bitcoin ETFs have reached approximately $90 billion. IBIT commands $54.5 billion of this total, representing nearly 60% market share. Combined net inflows across all products stand at roughly $56 billion.
The opening quarter of 2026 demonstrated volatility. Concerns regarding Federal Reserve policy triggered approximately $1.8 billion in withdrawals during January and February. March witnessed a $1.3 billion recovery as price stability returned.
Market observers warn that these positive flows could quickly reverse if upcoming inflation metrics exceed expectations. Attention is focused on Friday’s March Consumer Price Index release and Thursday’s February core Personal Consumption Expenditures data.
Technical Pattern Suggests $77K Breakthrough
Bitcoin’s daily price chart displays an ascending triangle configuration developing over recent weeks, characterized by progressively higher lows. This technical formation generally indicates accumulating buying momentum.
The Relative Strength Index has climbed back above the neutral 50 level, indicating strengthening bullish momentum. Technical analysts are monitoring for an RSI breakthrough above 60 as confirmation of sustained upward pressure.
Bitcoin’s profitable supply metric rebounded to 59% after temporarily declining to 52% in late February. Historical precedent suggests that drops below the 50% level have typically presented attractive entry points during previous market cycles.
As of publication, Bitcoin was changing hands at $68,714, based on CoinGecko data.


