


TLDR
Ethereum price dropped below $2,800 and tested support at $2,621 before attempting recovery to current levels around $2,841
BITMINE purchased 21,537 ETH worth $59.17 million, showing institutional confidence in Ethereum’s long-term prospects
The cryptocurrency faces key resistance at $2,890 and a bearish trend line at $2,960 that could determine next price direction
Technical indicators show RSI at 39.89 indicating oversold conditions, while MACD displays bearish momentum below signal line
Major support sits at $2,720 with potential downside to $2,620, while resistance levels extend to $4,250 where previous breakout attempts failed
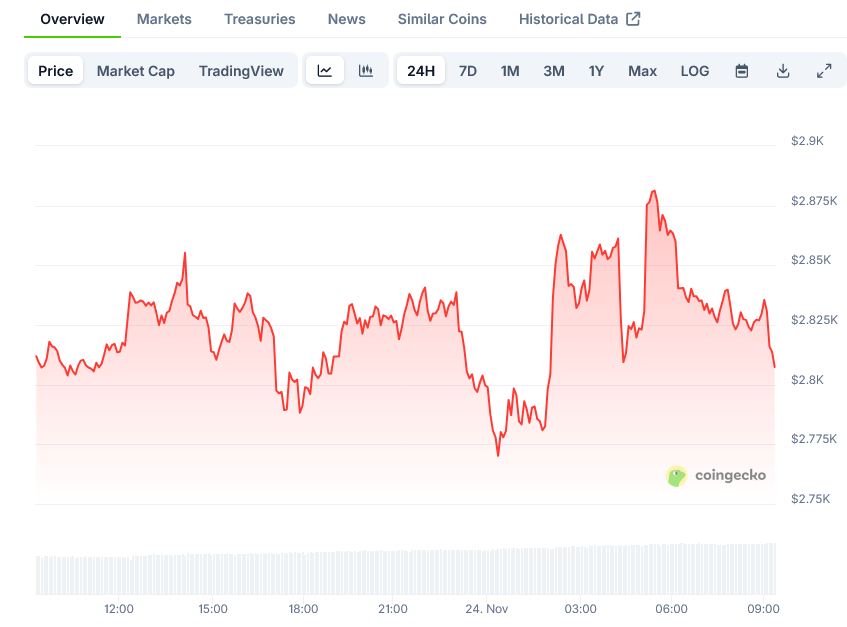
Ethereum (ETH) is trading at $2,841.07 after experiencing a volatile period that saw the cryptocurrency test multiple support and resistance levels. The price gained 4.52% over the last 24 hours following a decline that took it below key thresholds.
The cryptocurrency failed to maintain levels above $3,000 and entered a bearish phase. ETH dropped below $2,880 and continued falling through $2,800 and $2,700. The price reached a low of $2,621 before buyers stepped in to push it higher.
The current price sits near the 100-hourly Simple Moving Average. A recovery wave pushed the price above the 23.6% Fibonacci retracement level from the recent decline. The move from the $3,058 swing high to the $2,621 low created these technical levels.
BITMINE made a purchase of 21,537 ETH valued at $59.17 million. The acquisition demonstrates institutional interest in Ethereum as the network transitions to Ethereum 2.0. The company is expanding its digital asset holdings with this strategic move.
Crypto analyst Tom Lee maintains bullish expectations for Ethereum. His outlook focuses on the cryptocurrency’s applications in decentralized finance and NFT markets. The growing institutional investment supports his positive view.
Resistance Levels Create Price Barriers
The cryptocurrency faces immediate resistance at $2,890. This level aligns with the 61.8% Fibonacci retracement of the recent decline. The next resistance appears at $2,920, followed by a major barrier at $2,950.
A bearish trend line forms resistance at $2,960 on the hourly chart. Breaking above this level could send the price toward $3,020. Further upside movement might reach $3,120 or $3,250 in the near term.
Analyst CRYPTOWZRD identified strong resistance near $4,250. The cryptocurrency failed multiple times to break through this level. Previous attempts showed strong selling activity at this price point.
Technical Indicators Show Mixed Signals
The RSI stands at 39.89, indicating oversold conditions. This reading suggests a potential reversal could occur. The MACD indicator shows bearish momentum with the MACD line below the signal line.
The hourly MACD is losing momentum in the bearish zone. These technical readings suggest caution for traders watching the price action.
Support levels exist at $2,800 as the initial downside target. Major support sits at $2,720. A break below this level could push the price to $2,650 or $2,620. Further losses might test support at $2,550 and $2,500.
The current price tests the $2,800 support level. This area previously showed buying interest. Market participants watch whether this floor holds or breaks in the coming sessions.
The moving average ribbon shows a bearish crossover. This pattern suggests potential downward momentum if major support levels fail to hold. The price action remains range-bound between key support at $2,800 and resistance near $2,890.


